library(Gviz)
library(GenomicFeatures)
library(GenomicRanges)
library(GenomicInteractions)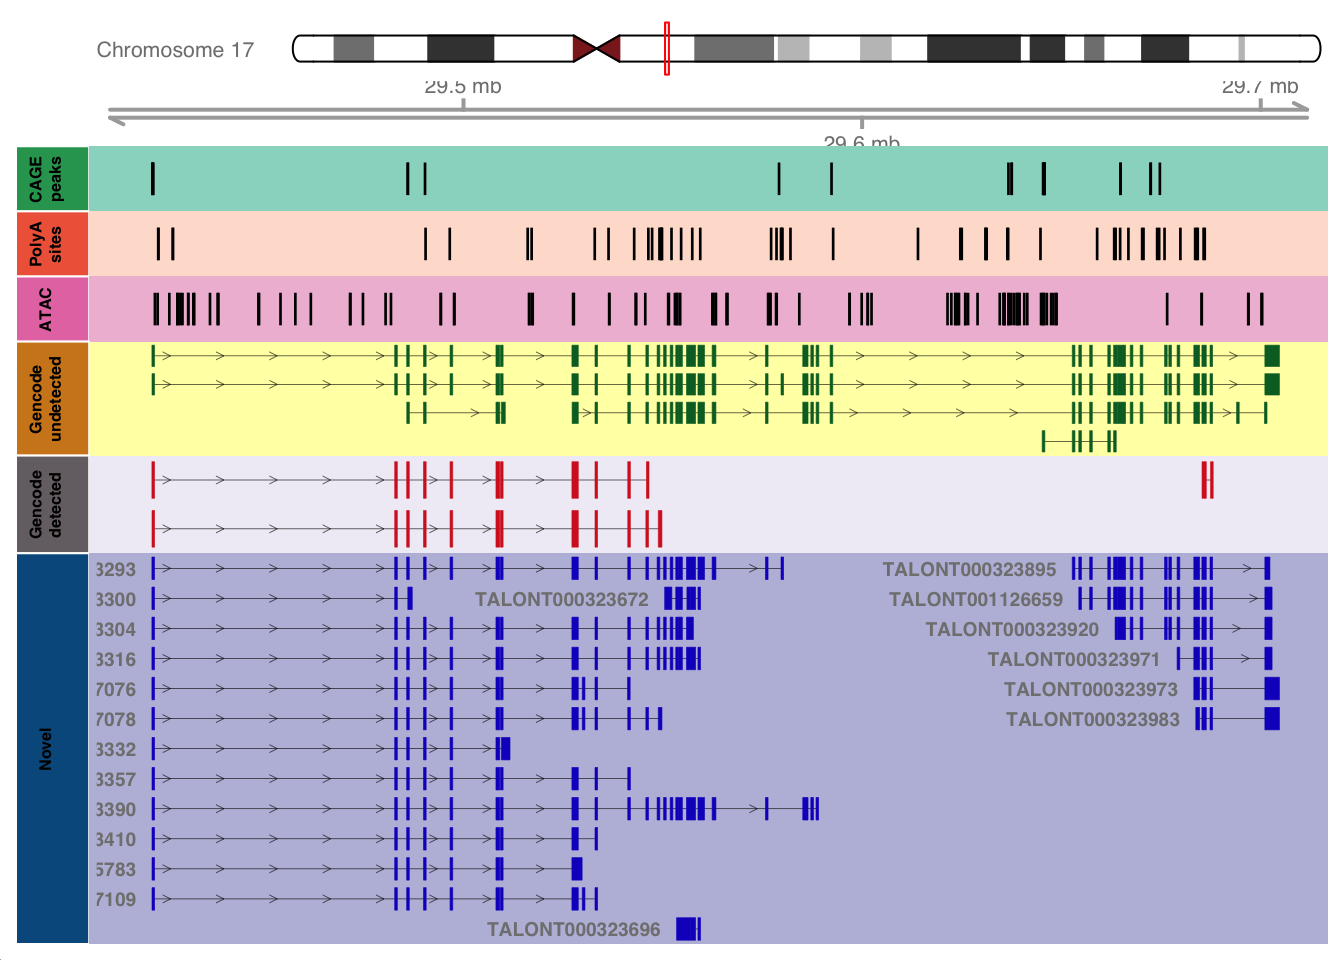
library(data.table)Figure 2 - NF1 Locus
Required libraries
options
options(stringsAsFactors = F)
options(Gviz.scheme = "myScheme")
options(ucscChromosomeNames = F)
global themes
scheme <- getScheme()
scheme$GeneRegionTrack$col <- NULL
addScheme(scheme, "myScheme")
prepare gencode
gencode="ref/gencode.v33lift37.annotation.gtf.gz"
gencode_txdb=makeTxDbFromGFF(gencode, format="gtf")
Import genomic features from the file as a GRanges object ... OK
Prepare the 'metadata' data frame ... OK
Make the TxDb object ... Warning in .get_cds_IDX(mcols0$type, mcols0$phase): The "phase" metadata column contains non-NA values for features of type
stop_codon. This information was ignored.Warning in .reject_transcripts(bad_tx, because): The following transcripts were dropped because they have incompatible
CDS and stop codons: ENST00000422803.2_2, ENST00000618549.1_2,
ENST00000619291.4_2, ENST00000621077.1_2, ENST00000621229.1_2,
ENST00000631326.2_2OKgencode_transcript=exonsBy(gencode_txdb,by="tx",use.names=T)prepare fetalIsoSeq
isoseq="data/cp_vz_0.75_min_7_recovery_talon.gtf.gz"
isoseq_txdb=makeTxDbFromGFF(isoseq, format="gtf")
Import genomic features from the file as a GRanges object ... OK
Prepare the 'metadata' data frame ... OK
Make the TxDb object ... OKisoseq_transcript=exonsBy(isoseq_txdb,by="tx",use.names=T)peak files
cagefile=fread("data/all_cage.txt.gz",header = F)
polyafile=fread("data/polya.txt.gz",header = F)
atacfile=fread("data/all_atac.txt.gz",header = F)
genes of interest
genes_to_plot=read.delim("data/plotgene_transcripts_codingOnly_finalFrezee_reannotated.txt",header = F)

current_gene="NF1"
chr=unique(genes_to_plot$V1[genes_to_plot$V2 == current_gene])
strd=unique(genes_to_plot$V4[genes_to_plot$V2 == current_gene])
GRange object for transcripts
options(ucscChromosomeNames=FALSE)

gencode_only=base::setdiff(with(genes_to_plot,V3[V2 == current_gene & V5=="gencode"]) , with(genes_to_plot,V3[V2 == current_gene & V5=="fetalIsoSeq"]))
shared=base::intersect(with(genes_to_plot,V3[V2 == current_gene & V5=="gencode"]) , with(genes_to_plot,V3[V2 == current_gene & V5=="fetalIsoSeq"]))
novel=base::setdiff(with(genes_to_plot,V3[V2 == current_gene & V5=="fetalIsoSeq"]) , with(genes_to_plot,V3[V2 == current_gene & V5=="gencode"]))
novel=novel[grepl("^TALON",novel)]

gencode_only_transcript_onegene=gencode_transcript[gencode_only,]
gencode_only_transcript_onegene=unlist(gencode_only_transcript_onegene)
elementMetadata(gencode_only_transcript_onegene)$transcript <- names(gencode_only_transcript_onegene)
gencode_only_track=GeneRegionTrack(gencode_only_transcript_onegene,group = "transcirpt",name = "Gencode undetected")

shared_transcript=gencode_transcript[shared,]
shared_transcript=unlist(shared_transcript)
elementMetadata(shared_transcript)$transcript=names(shared_transcript)
shared_track=GeneRegionTrack(shared_transcript,group = "transcript",name = "Gencode detected")

isoseq_transcript_onegene=isoseq_transcript[novel,]
isoseq_transcript_onegene=unlist(isoseq_transcript_onegene)
elementMetadata(isoseq_transcript_onegene)$transcript=names(isoseq_transcript_onegene)
isoseq_track=GeneRegionTrack(isoseq_transcript_onegene,group = "transcript",name = "Novel")

displayPars(gencode_only_track)=list(stacking="squish",
                                     background.panel = "#ffffb2",
                                     fill="#006d2c",
                                     col="#006d2c",
                                     lwd=0.3,
                                     col.line="black",
                                     fontcolor.title="black",
                                     background.title="#d1861d")
displayPars(shared_track)=list(stacking="squish",
                               background.panel = "#f1eef6",
                               fill="#d62424",
                               col="#d62424",
                               lwd=0.3,
                               col.line="black",
                               fontcolor.title="black",
                               background.title="#756e72")
displayPars(isoseq_track)=list(stacking="squish",
                               background.panel = "#bcbddc",
                               fill="#171cc7",
                               col="#171cc7",
                               lwd=0.3,
                               col.line="black",
                               showId = TRUE,
                               transcriptAnnotation = "transcript",
                               fontcolor.title="black",
                               background.title="#045a8d")
universal tracks
axisTrack <- GenomeAxisTrack()
ideoTrack <- IdeogramTrack(genome = "hg19", chromosome = chr)
find plot range
leftmost=min(c(gencode_only_transcript_onegene@ranges@start,shared_transcript@ranges@start,isoseq_transcript_onegene@ranges@start))
rightmost=max(c(gencode_only_transcript_onegene@ranges@start,shared_transcript@ranges@start,isoseq_transcript_onegene@ranges@start))

currentcagefile=cagefile[cagefile$V1 == chr & cagefile$V4 == strd & cagefile$V2 >= leftmost & cagefile$V3 <= rightmost,]
currentpolyafile=polyafile[polyafile$V1 == chr & polyafile$V4 == strd & polyafile$V2 >= leftmost & polyafile$V3 <= rightmost,]
currentatacfile=atacfile[atacfile$V1 == chr & atacfile$V2 >= leftmost & atacfile$V3 <= rightmost,]

currentcagefile=currentcagefile[!duplicated(currentcagefile),]
currentpolyafile=currentpolyafile[!duplicated(currentpolyafile),]
currentatacfile=currentatacfile[!duplicated(currentatacfile),]
CAGE, ployA and ATAC tracks
cage=AnnotationTrack(start=currentcagefile$V2,
                     end = currentcagefile$V3,
                     chromosome = currentcagefile$V1,
                     strand = currentcagefile$V4,
                     background.panel = "#99d8c9",
                     stacking = "full",
                     fill="black",
                     name = "CAGE peaks",
                     col=NULL,
                     col.line="#99d8c9",
                     background.title="#2ca25f",
                     fontcolor.title="black")


polya=AnnotationTrack(start=currentpolyafile$V2,
                      end = currentpolyafile$V3,
                      chromosome = currentpolyafile$V1,
                      strand = currentpolyafile$V4,
                      background.panel = "#fee0d2",
                      fill="black",
                      name = "PolyA sites",
                      col=NULL,
                      col.line="#fee0d2",
                      background.title="#ef6548",
                      fontcolor.title="black")

atac=AnnotationTrack(start=currentatacfile$V2,
                     end = currentatacfile$V3,
                     chromosome = currentatacfile$V1,
                     background.panel = "#f0bdd7",
                     fill="black",
                     name = "ATAC",
                     col=NULL,
                     col.line="#f0bdd7",
                     background.title="#e67ab1",
                     fontcolor.title="black")


displayPars(cage)$stacking="dense"
displayPars(polya)$stacking="dense"
displayPars(atac)$stacking="dense"
plot
extra=(rightmost - leftmost)*0.05

plotTracks(list(ideoTrack,axisTrack,cage,polya,atac,gencode_only_track,shared_track,isoseq_track),
           chromosome = chr,
           from = leftmost - extra,
           to = rightmost + extra,
           sizes = c(1,1,1,1,1,max(1.5,0.35*length(gencode_only)),max(1.5,0.35*length(shared)),max(2,0.3*length(novel))))