# remotes::install_github("davidsjoberg/ggsankey")
library(tidyverse)
library(ggsankey)
ashok_data <- read.table("data/single_cell/4allu_plot.txt", header = T)
all_ctypes <- c(unique(ashok_data$nCount_RNA), unique(ashok_data$IsoCellType))
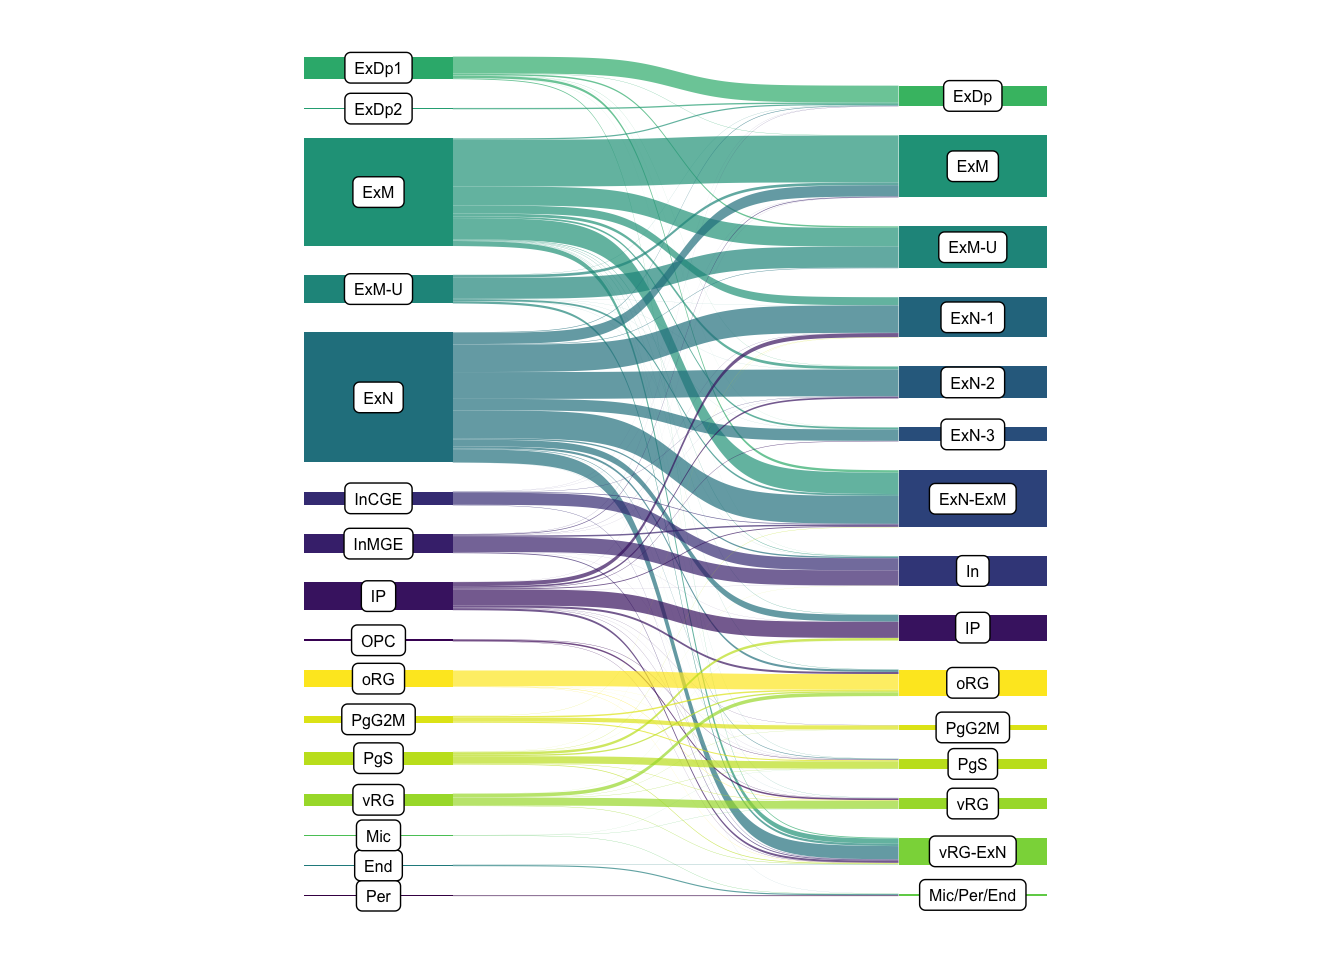
ordered_ctypes <-c("Per", "End", "Mic", "Mic/Per/End",
"vRG-ExN", "vRG", "PgS", "PgG2M",
"oRG", "OPC", "IP",
"InMGE", "InCGE", "In", "ExN-ExM", "ExN-3",
"ExN-2", "ExN-1", "ExN", "ExM-U", "ExM",
"ExDp2", "ExDp1", "ExDp")
ctype_map <- tibble(name = ordered_ctypes, id = 1:length(unique(all_ctypes)))
ashok_data_before <- inner_join(tibble(name = ashok_data$nCount_RNA), ctype_map)
ashok_data_after <- inner_join(tibble(name = ashok_data$IsoCellType), ctype_map)
alluvial_data <- tibble(before = ashok_data_before$id,
                        after = ashok_data_after$id)

df <- alluvial_data %>%
  make_long(before, after)

node_name_tbl <- tibble(node = ctype_map$id, name = ctype_map$name)
df <- inner_join(df, node_name_tbl)
df <- df %>% arrange(node, next_node)

ggplot(df, aes(x = x, next_x = next_x, node = node, next_node = next_node, fill = factor(node), label = name)) +
  geom_alluvial(flow.alpha = .7, width = 0.25, space = 300) +
  geom_alluvial_label(size = 6 * 25.4 / 72.27, color = "black", fill = "white", space = 300) +
  scale_fill_viridis_d() +
  theme_alluvial() +
  labs(x = NULL, y = NULL) +
  theme(
    legend.position = "none",
    axis.text.x = element_blank(),
    axis.ticks.x = element_blank(),
    axis.text.y = element_blank(),
    axis.ticks.y = element_blank()
  )