suppressPackageStartupMessages({
  library(tidyverse)
})Figure 2 - External Support
source("code/talon_novelty_to_factor.R")CP/GZ with split ISMs
cts = read_table("data/cp_vz_0.75_min_7_recovery_talon_abundance_filtered.tsv.gz")
── Column specification ────────────────────────────────────────────────────────
cols(
  .default = col_double(),
  annot_gene_id = col_character(),
  annot_transcript_id = col_character(),
  annot_gene_name = col_character(),
  annot_transcript_name = col_character(),
  gene_novelty = col_character(),
  transcript_novelty = col_character(),
  ISM_subtype = col_character()
)
ℹ Use `spec()` for the full column specifications.
sqanti = read_tsv("data/sqanti/cp_vz_0.75_min_7_recovery_talon_classification.txt.gz")Rows: 214516 Columns: 48── Column specification ────────────────────────────────────────────────────────
Delimiter: "\t"
chr (14): isoform, chrom, strand, structural_category, associated_gene, asso...
dbl (21): length, exons, ref_length, ref_exons, diff_to_TSS, diff_to_TTS, di...
lgl (13): RTS_stage, FL, n_indels, n_indels_junc, bite, iso_exp, gene_exp, r...
ℹ Use `spec()` to retrieve the full column specification for this data.
ℹ Specify the column types or set `show_col_types = FALSE` to quiet this message.theme_set(theme_bw())
theme_update(
plot.title = element_text(size = rel(1.4), hjust = 0.5),
axis.title = element_text(size = rel(1.2)),
axis.text = element_text(color="black", size = rel(1)),
legend.title = element_text(size = rel(1.2)),
legend.text = element_text(color="black", size = rel(1)),
strip.text = element_text(color="black", size = rel(1))
)support_for_plot = cts %>% select(transcript_id = annot_transcript_id, transcript_novelty, ISM_subtype) %>%
left_join(
read_csv("data/within_CAGE/cpvz_refTSS_200_CAGE_results.csv") %>%
mutate(CAGE_support = CAGE_support == "yes") %>%
dplyr::rename(within_CAGE_refTSS = "CAGE_support"),
by = c("transcript_id" = "transcript_ID")
) %>%
left_join(
read_csv("data/within_CAGE/cpvz_fetal_200_CAGE_results.csv") %>%
mutate(CAGE_support = CAGE_support == "yes") %>%
dplyr::rename(within_CAGE_fetal = "CAGE_support"),
by = c("transcript_id" = "transcript_ID")
) %>%
left_join(
read_csv("data/within_ATAC/cpvz_Greenleaf_500_ATAC_results.csv") %>%
mutate(CAGE_support = CAGE_support == "yes") %>%
dplyr::rename(within_ATAC_Greenleaf = "CAGE_support"),
by = c("transcript_id" = "transcript_ID")
) %>%
left_join(
read_csv("data/within_ATAC/cpvz_Nowakowski_500_ATAC_results.csv") %>%
mutate(CAGE_support = CAGE_support == "yes") %>%
dplyr::rename(within_ATAC_Nowakowski = "CAGE_support"),
by = c("transcript_id" = "transcript_ID")
) %>%
left_join(
read_csv("data/within_ATAC/cpvz_LuisCP_500_ATAC_results.csv") %>%
mutate(CAGE_support = CAGE_support == "yes") %>%
dplyr::rename(within_ATAC_LuisCP = "CAGE_support"),
by = c("transcript_id" = "transcript_ID")
) %>%
left_join(
read_csv("data/within_ATAC/cpvz_LuisVZ_500_ATAC_results.csv") %>%
mutate(CAGE_support = CAGE_support == "yes") %>%
dplyr::rename(within_ATAC_LuisGZ = "CAGE_support"),
by = c("transcript_id" = "transcript_ID")
) %>%
left_join(
sqanti %>% select(isoform, within_polyA_site, polyA_motif_found),
by = c("transcript_id" = "isoform")
) %>%
mutate(across(!c("transcript_id", "transcript_novelty", "ISM_subtype"), replace_na, FALSE))Rows: 214516 Columns: 2
── Column specification ────────────────────────────────────────────────────────
Delimiter: ","
chr (2): transcript_ID, CAGE_support
ℹ Use `spec()` to retrieve the full column specification for this data.
ℹ Specify the column types or set `show_col_types = FALSE` to quiet this message.
Rows: 214516 Columns: 2
── Column specification ────────────────────────────────────────────────────────
Delimiter: ","
chr (2): transcript_ID, CAGE_support
ℹ Use `spec()` to retrieve the full column specification for this data.
ℹ Specify the column types or set `show_col_types = FALSE` to quiet this message.support_for_plot# A tibble: 214,516 × 11
transcript_id trans…¹ ISM_s…² withi…³ withi…⁴ withi…⁵ withi…⁶ withi…⁷ withi…⁸
<chr> <chr> <chr> <lgl> <lgl> <lgl> <lgl> <lgl> <lgl>
1 ENST00000494… Known None FALSE FALSE FALSE FALSE FALSE FALSE
2 ENST00000424… Known None FALSE FALSE FALSE FALSE FALSE FALSE
3 ENST00000445… Known None FALSE FALSE FALSE FALSE FALSE FALSE
4 ENST00000457… Known None TRUE TRUE TRUE TRUE FALSE FALSE
5 ENST00000414… Known None TRUE FALSE FALSE FALSE FALSE FALSE
6 ENST00000655… Known None FALSE TRUE TRUE TRUE FALSE FALSE
7 ENST00000457… Known None FALSE TRUE TRUE TRUE FALSE FALSE
8 ENST00000591… Known None FALSE FALSE FALSE FALSE FALSE FALSE
9 ENST00000644… Known None FALSE FALSE FALSE FALSE FALSE FALSE
10 ENST00000445… Known None TRUE TRUE TRUE TRUE FALSE FALSE
# … with 214,506 more rows, 2 more variables: within_polyA_site <lgl>,
# polyA_motif_found <lgl>, and abbreviated variable names
# ¹transcript_novelty, ²ISM_subtype, ³within_CAGE_refTSS, ⁴within_CAGE_fetal,
# ⁵within_ATAC_Greenleaf, ⁶within_ATAC_Nowakowski, ⁷within_ATAC_LuisCP,
# ⁸within_ATAC_LuisGZsupport_for_plot2 = support_for_plot %>%
talon_novelty_to_factor(split_ISMs = T) %>%
group_by(transcript_novelty) %>%
summarize(
# any_5p = sum(within_CAGE_refTSS | within_CAGE_fetal | within_ATAC_Greenleaf | within_ATAC_Nowakowski, na.rm = T),
within_CAGE_peak = sum(within_CAGE_refTSS | within_CAGE_fetal, na.rm = T),
within_ATAC_peak = sum(within_ATAC_Greenleaf | within_ATAC_Nowakowski | within_ATAC_LuisCP | within_ATAC_LuisGZ, na.rm = T),
# any_3p = sum(within_polyA_site | polyA_motif_found, na.rm = T),
within_polyA_site = sum(within_polyA_site, na.rm = T),
polyA_motif_found = sum(polyA_motif_found, na.rm = T),
n = n()
) %>%
pivot_longer(!c("transcript_novelty", "n")) %>%
mutate(prop = value / n) %>%
mutate(end = if_else(name %in% c("within_polyA_site", "polyA_motif_found", "any_3p"), "3' support", "5' support")) %>%
mutate(end = end %>% factor(levels = c("5' support", "3' support"))) %>%
mutate(name = name %>% as_factor())
support_for_plot2# A tibble: 24 × 6
transcript_novelty n name value prop end
<fct> <int> <fct> <int> <dbl> <fct>
1 Known 23503 within_CAGE_peak 21451 0.913 5' support
2 Known 23503 within_ATAC_peak 22024 0.937 5' support
3 Known 23503 within_polyA_site 17940 0.763 3' support
4 Known 23503 polyA_motif_found 17581 0.748 3' support
5 ISM_Prefix 30273 within_CAGE_peak 29743 0.982 5' support
6 ISM_Prefix 30273 within_ATAC_peak 29733 0.982 5' support
7 ISM_Prefix 30273 within_polyA_site 10334 0.341 3' support
8 ISM_Prefix 30273 polyA_motif_found 14149 0.467 3' support
9 ISM_Suffix 8942 within_CAGE_peak 4432 0.496 5' support
10 ISM_Suffix 8942 within_ATAC_peak 4365 0.488 5' support
# … with 14 more rowsggplot(support_for_plot2, aes(x = prop, y = transcript_novelty, fill = fct_rev(name))) +
geom_col(position = "dodge") +
scale_y_discrete(
limits = rev,
labels = c("ISM_Prefix" = "ISM Prefix", "ISM_Suffix" = "ISM Suffix")
) +
scale_fill_manual(
limits = c("within_CAGE_peak", "within_ATAC_peak", "within_polyA_site", "polyA_motif_found"),
labels = c("CAGE", "ATAC-seq", "polyA site", "polyA motif"),
values = c("#00bfc4", "#00a9ff", "#c77cff", "#ff61cc")
) +
labs(
x = "Proportion of transcripts",
y = NULL,
fill = NULL
) +
guides(
fill = guide_legend(ncol = 2)
) +
theme(
panel.grid.major = element_blank(),
panel.grid.minor = element_blank(),
legend.position = "bottom",
panel.spacing = unit(2, "lines"),
plot.margin = margin(11, 11, 11, 11, "points")
) +
facet_wrap(vars(end))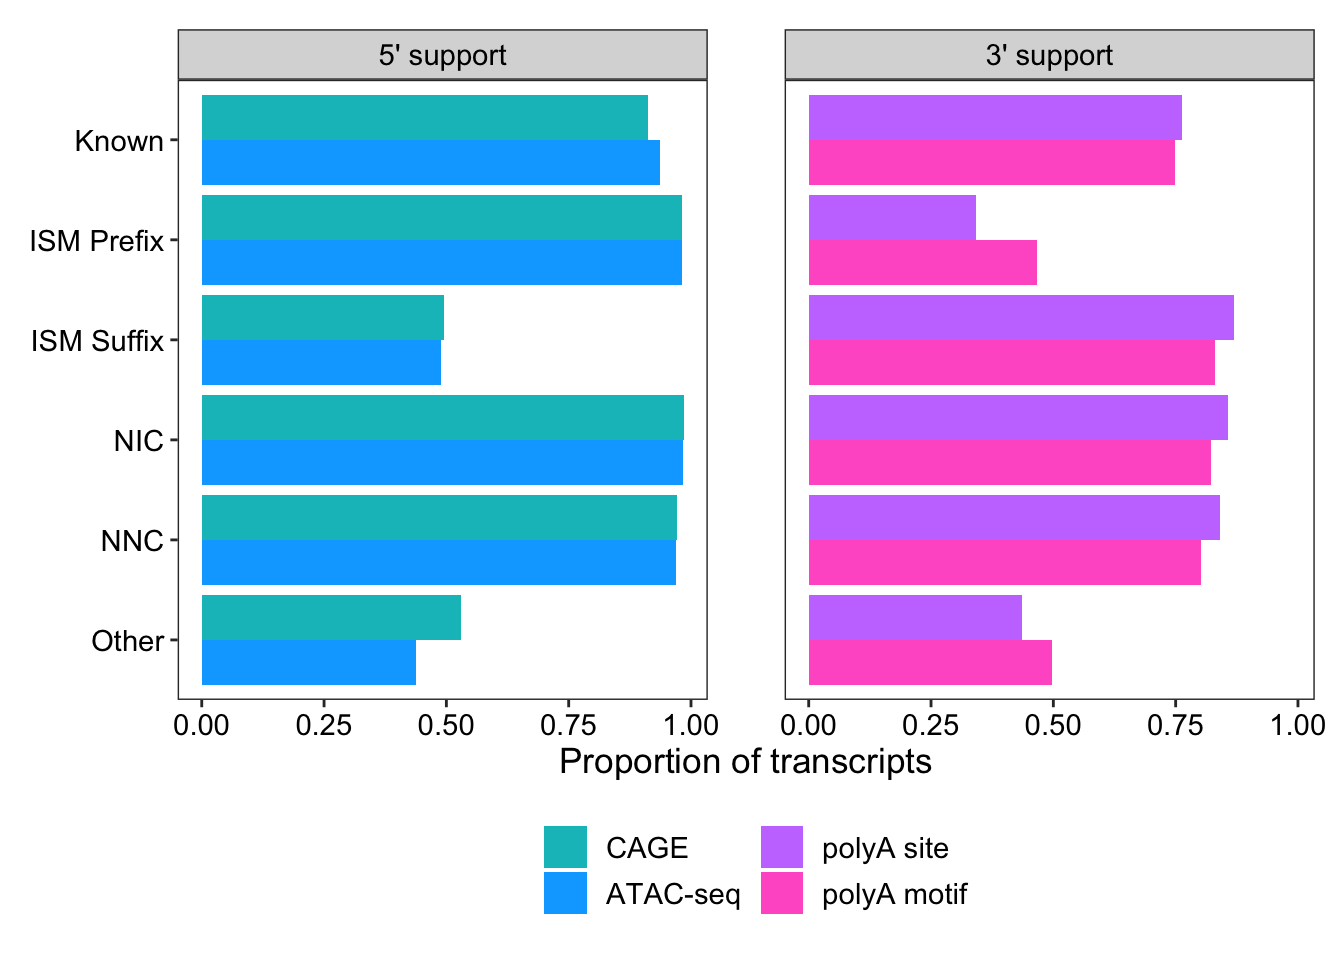
ggsave("output/figures/revision1/Fig2B_split.pdf", width = 4.5, height = 3.25)single cell version
cts = read_table("data/Fig_S9H/scIsoseq_4kcells_final_talon_abundance_filtered.tsv.gz")
── Column specification ────────────────────────────────────────────────────────
cols(
  .default = col_double(),
  annot_gene_id = col_character(),
  annot_transcript_id = col_character(),
  annot_gene_name = col_character(),
  annot_transcript_name = col_character(),
  gene_novelty = col_character(),
  transcript_novelty = col_character(),
  ISM_subtype = col_character()
)
ℹ Use `spec()` for the full column specifications.
sqanti = read_tsv("data/Fig_S9H/scIsoseq_4kcells_final.talon.SQANTI3/scIsoseq_4kcells_final.talon_classification.txt.gz")Rows: 87162 Columns: 48── Column specification ────────────────────────────────────────────────────────
Delimiter: "\t"
chr (14): isoform, chrom, strand, structural_category, associated_gene, asso...
dbl (21): length, exons, ref_length, ref_exons, diff_to_TSS, diff_to_TTS, di...
lgl (13): RTS_stage, FL, n_indels, n_indels_junc, bite, iso_exp, gene_exp, r...
ℹ Use `spec()` to retrieve the full column specification for this data.
ℹ Specify the column types or set `show_col_types = FALSE` to quiet this message.support_for_plot = cts %>% select(transcript_id = annot_transcript_id, transcript_novelty, ISM_subtype) %>%
left_join(
read_csv("data/Fig_S9H/sc_refTSS_200_CAGE_results.csv") %>%
mutate(CAGE_support = CAGE_support == "yes") %>%
dplyr::rename(within_CAGE_refTSS = "CAGE_support"),
by = c("transcript_id" = "transcript_ID")
) %>%
left_join(
read_csv("data/Fig_S9H/sc_fetal_200_CAGE_results.csv") %>%
mutate(CAGE_support = CAGE_support == "yes") %>%
dplyr::rename(within_CAGE_fetal = "CAGE_support"),
by = c("transcript_id" = "transcript_ID")
) %>%
left_join(
read_csv("data/Fig_S9H/sc_Greenleaf_500_ATAC_results.csv") %>%
mutate(CAGE_support = CAGE_support == "yes") %>%
dplyr::rename(within_ATAC_Greenleaf = "CAGE_support"),
by = c("transcript_id" = "transcript_ID")
) %>%
left_join(
read_csv("data/Fig_S9H/sc_Nowakowski_500_ATAC_results.csv") %>%
mutate(CAGE_support = CAGE_support == "yes") %>%
dplyr::rename(within_ATAC_Nowakowski = "CAGE_support"),
by = c("transcript_id" = "transcript_ID")
) %>%
left_join(
read_csv("data/Fig_S9H/sc_LuisCP_500_ATAC_results.csv") %>%
mutate(CAGE_support = CAGE_support == "yes") %>%
dplyr::rename(within_ATAC_LuisCP = "CAGE_support"),
by = c("transcript_id" = "transcript_ID")
) %>%
left_join(
read_csv("data/Fig_S9H/sc_LuisVZ_500_ATAC_results.csv") %>%
mutate(CAGE_support = CAGE_support == "yes") %>%
dplyr::rename(within_ATAC_LuisGZ = "CAGE_support"),
by = c("transcript_id" = "transcript_ID")
) %>%
left_join(
sqanti %>% select(isoform, within_polyA_site, polyA_motif_found),
by = c("transcript_id" = "isoform")
) %>%
mutate(across(!c("transcript_id", "transcript_novelty", "ISM_subtype"), replace_na, FALSE))Rows: 87162 Columns: 2
── Column specification ────────────────────────────────────────────────────────
Delimiter: ","
chr (2): transcript_ID, CAGE_support
ℹ Use `spec()` to retrieve the full column specification for this data.
ℹ Specify the column types or set `show_col_types = FALSE` to quiet this message.
Rows: 87162 Columns: 2
── Column specification ────────────────────────────────────────────────────────
Delimiter: ","
chr (2): transcript_ID, CAGE_support
ℹ Use `spec()` to retrieve the full column specification for this data.
ℹ Specify the column types or set `show_col_types = FALSE` to quiet this message.support_for_plot# A tibble: 87,162 × 11
transcript_id trans…¹ ISM_s…² withi…³ withi…⁴ withi…⁵ withi…⁶ withi…⁷ withi…⁸
<chr> <chr> <chr> <lgl> <lgl> <lgl> <lgl> <lgl> <lgl>
1 ENST00000416… Known None TRUE TRUE FALSE TRUE FALSE FALSE
2 ENST00000457… Known None TRUE TRUE TRUE TRUE FALSE FALSE
3 ENST00000414… Known None TRUE FALSE FALSE FALSE FALSE FALSE
4 ENST00000473… Known None TRUE TRUE TRUE TRUE FALSE FALSE
5 ENST00000327… Known None TRUE TRUE TRUE TRUE FALSE FALSE
6 ENST00000469… Known None TRUE TRUE TRUE TRUE FALSE FALSE
7 ENST00000338… Known None TRUE TRUE TRUE TRUE FALSE FALSE
8 ENST00000428… Known None TRUE TRUE TRUE TRUE FALSE FALSE
9 ENST00000304… Known None TRUE TRUE TRUE TRUE FALSE FALSE
10 ENST00000481… Known None TRUE TRUE TRUE TRUE FALSE FALSE
# … with 87,152 more rows, 2 more variables: within_polyA_site <lgl>,
# polyA_motif_found <lgl>, and abbreviated variable names
# ¹transcript_novelty, ²ISM_subtype, ³within_CAGE_refTSS, ⁴within_CAGE_fetal,
# ⁵within_ATAC_Greenleaf, ⁶within_ATAC_Nowakowski, ⁷within_ATAC_LuisCP,
# ⁸within_ATAC_LuisGZsupport_for_plot2 = support_for_plot %>%
talon_novelty_to_factor(split_ISMs = T) %>%
group_by(transcript_novelty) %>%
summarize(
# any_5p = sum(within_CAGE_refTSS | within_CAGE_fetal | within_ATAC_Greenleaf | within_ATAC_Nowakowski, na.rm = T),
within_CAGE_peak = sum(within_CAGE_refTSS | within_CAGE_fetal, na.rm = T),
within_ATAC_peak = sum(within_ATAC_Greenleaf | within_ATAC_Nowakowski | within_ATAC_LuisCP | within_ATAC_LuisGZ, na.rm = T),
# any_3p = sum(within_polyA_site | polyA_motif_found, na.rm = T),
within_polyA_site = sum(within_polyA_site, na.rm = T),
polyA_motif_found = sum(polyA_motif_found, na.rm = T),
n = n()
) %>%
pivot_longer(!c("transcript_novelty", "n")) %>%
mutate(prop = value / n) %>%
mutate(end = if_else(name %in% c("within_polyA_site", "polyA_motif_found", "any_3p"), "3' support", "5' support")) %>%
mutate(end = end %>% factor(levels = c("5' support", "3' support"))) %>%
mutate(name = name %>% as_factor())
support_for_plot2# A tibble: 24 × 6
transcript_novelty n name value prop end
<fct> <int> <fct> <int> <dbl> <fct>
1 Known 65006 within_CAGE_peak 49495 0.761 5' support
2 Known 65006 within_ATAC_peak 54138 0.833 5' support
3 Known 65006 within_polyA_site 42187 0.649 3' support
4 Known 65006 polyA_motif_found 41856 0.644 3' support
5 ISM_Prefix 22053 within_CAGE_peak 21440 0.972 5' support
6 ISM_Prefix 22053 within_ATAC_peak 21520 0.976 5' support
7 ISM_Prefix 22053 within_polyA_site 10085 0.457 3' support
8 ISM_Prefix 22053 polyA_motif_found 12899 0.585 3' support
9 ISM_Suffix 55606 within_CAGE_peak 17334 0.312 5' support
10 ISM_Suffix 55606 within_ATAC_peak 21612 0.389 5' support
# … with 14 more rowsggplot(support_for_plot2, aes(x = prop, y = transcript_novelty, fill = fct_rev(name))) +
geom_col(position = "dodge") +
scale_y_discrete(
limits = rev,
labels = c("ISM_Prefix" = "ISM Prefix", "ISM_Suffix" = "ISM Suffix")
) +
scale_fill_manual(
limits = c("within_CAGE_peak", "within_ATAC_peak", "within_polyA_site", "polyA_motif_found"),
labels = c("CAGE", "ATAC-seq", "polyA site", "polyA motif"),
values = c("#00bfc4", "#00a9ff", "#c77cff", "#ff61cc")
) +
labs(
x = "Proportion of transcripts",
y = NULL,
fill = NULL
) +
guides(
fill = guide_legend(ncol = 2)
) +
theme(
panel.grid.major = element_blank(),
panel.grid.minor = element_blank(),
legend.position = "bottom",
panel.spacing = unit(2, "lines"),
plot.margin = margin(11, 11, 11, 11, "points")
) +
facet_wrap(vars(end))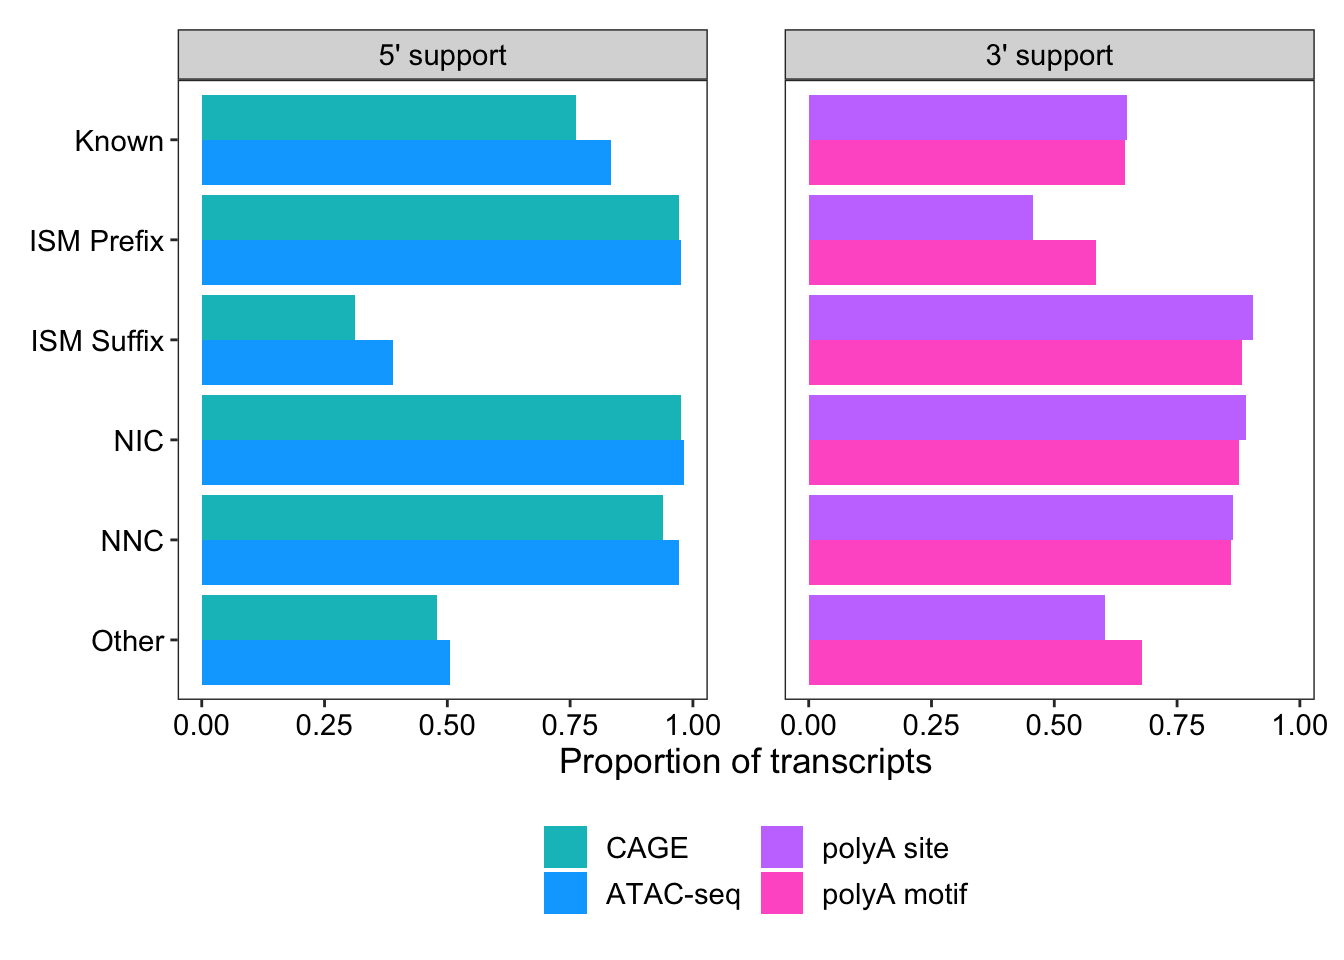
ggsave("output/figures/revision1/Fig2B_single_cell_ver_split.pdf", width = 8, height = 6)